
Run MODFLOW with geophysical structure#
Question: how does interpreted subsurface structure change a hydrological simulation when the forcing and layer properties are held fixed?
This small example uses real topography and interpreted regolith / fractured-rock depth arrays from Geophysics_informed_models. It creates two MODFLOW 6 input decks, runs both, and compares heads and drain discharge. It needs no ParFlow, seismic inversion package, GPU or GIS software.
Run it#
Use a current PyHydroGeophysX source installation containing model_input and
install the small example dependencies into that environment:
python -m pip install flopy numpy matplotlib jupyterlab
jupyter lab examples/Ex_MODFLOW_geophysics_feedback.ipynb
Run the notebook cells in order. In the settings cell, set mf6 to your
executable path or download=True to download the official executable through
FloPy. Leaving mf6=None searches PATH. Set write_only=True to inspect
inputs without running a solver. output=None creates a new output folder;
an explicit output path must name a new directory.
For a standalone notebook or script download, extract the small data archive beside it; the archive supplies
data/modflow_informed/. A source checkout already includes these files.
The executable download needs internet; the model itself runs offline.
What is connected#
Geophysical interpretation: load the supplied depths; this example does not reinvert the seismic data or estimate conductivity from velocity.
Hydrological geometry: subtract depths from terrain elevation to form regolith and fractured-rock interfaces in a 37 × 31 grid at 5 m spacing.
Controlled comparison: build a uniform-thickness baseline, then use
write_modflow6_inputs(..., {"bottom_elevation": ...})to export the varying interfaces. Keep total model base, hydraulic properties and forcing unchanged.Model response: run 30 daily steps and compare final heads and drain discharge. Check normal termination and water-budget discrepancies.
Inspect the outputs#
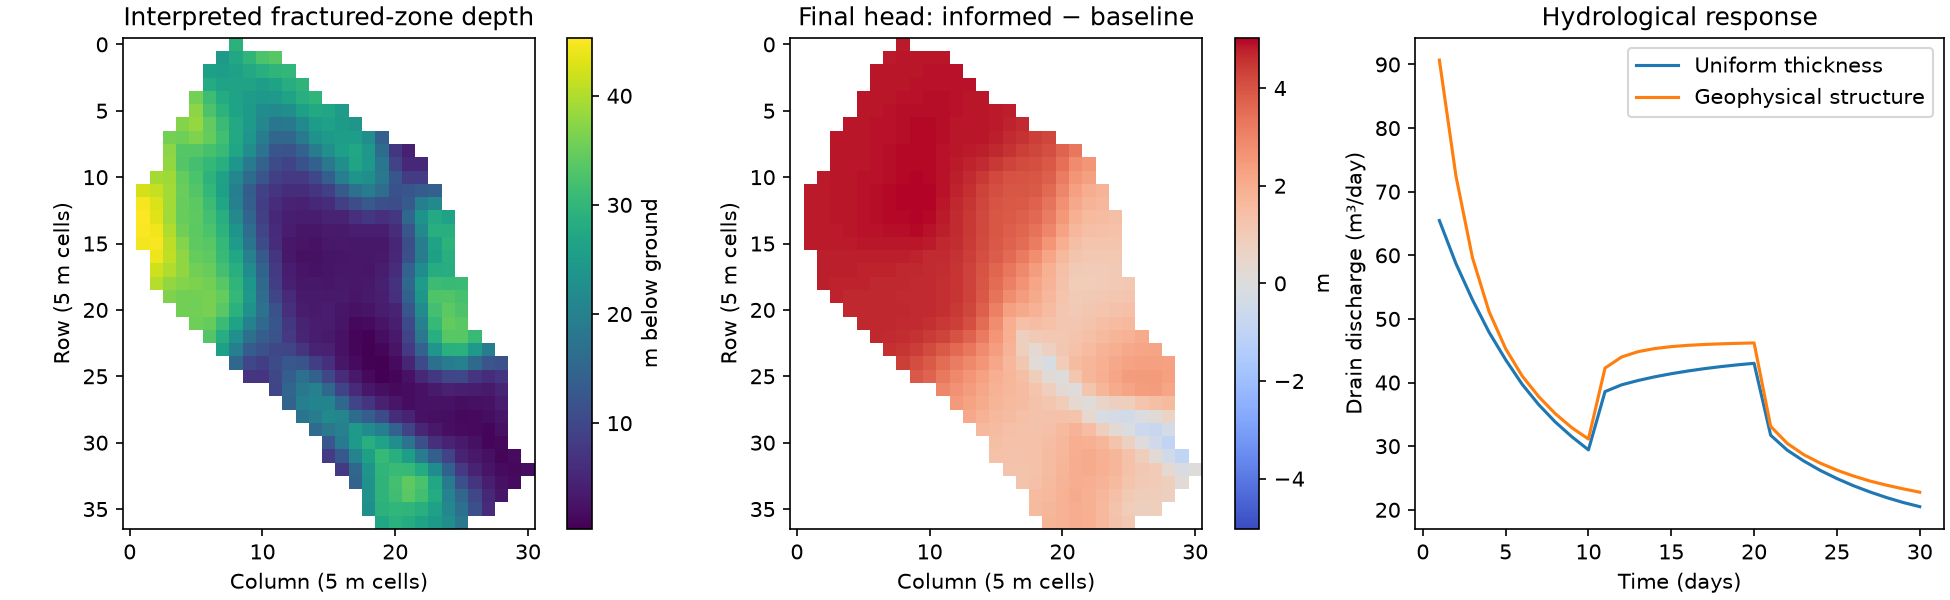
Verified example output. Differences show structural sensitivity under the same illustrative forcing and hydraulic properties.#
comparison.png: interpreted depth, head difference and discharge curves.summary.json: completion status and maximum reported budget discrepancy.comparison.npz: head arrays, active mask, times and discharge series.baseline/andinformed/: independent inputs, solver logs and outputs.
The test model has 1,866 active cells and uses confined storage, prescribed
recharge, drains and one fixed-head outlet. Layer conductivities are illustrative.
It demonstrates sensitivity to structure, not improved predictive accuracy or
reproduction of the original calibrated catchment study. It does not model UZF,
stream routing or calibration. The original data and license remain attributed
in examples/data/modflow_informed/provenance.json and LICENSE.
See also
Ex. Geophysical structure → MODFLOW → hydrological response for the complete script; Write updates back to hydrological models for parameter/state conversion and writing.